Introduced in 2007 by Steve Jobs, the iPhone has seen at least 190 million annual shipments each year since 2014.
Continue reading to find the latest iPhone stats for 2023.
Here’s a quick summary of what we’ll cover:
iPhone Key Stats
More than 1 billion consumers currently use iPhones.
Since its initial launch, more than 1.9 billion iPhones have been sold.
Apple shipped 206.1 million iPhones in 2020.

iPhones have a 65% share of smartphone sales in the US.
6 of the top 10 most sold smartphone models in January 2021 were designed by Apple.
iPhone users
An estimated 1 billion people use iPhones worldwide. That’s an increase of 5.48% over the past year.
The total number of active iPhone users has increased by 22.85% since 2017, with the number of iPhones in use growing by 186 million.
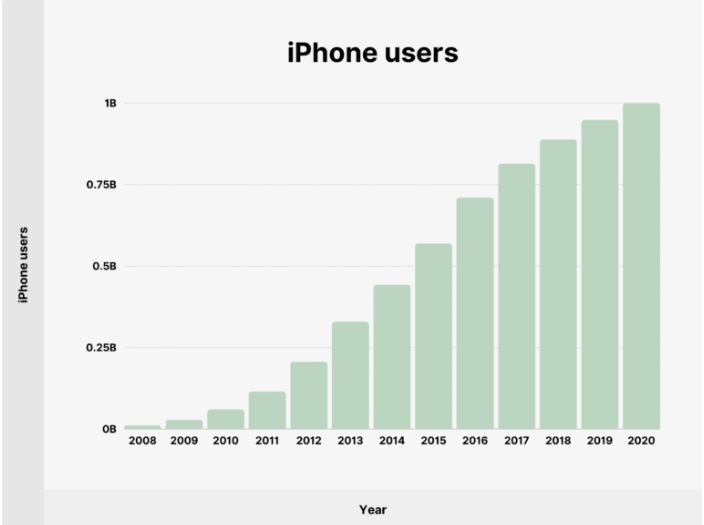
Here’s a table with the total number of iPhone users since 2008:
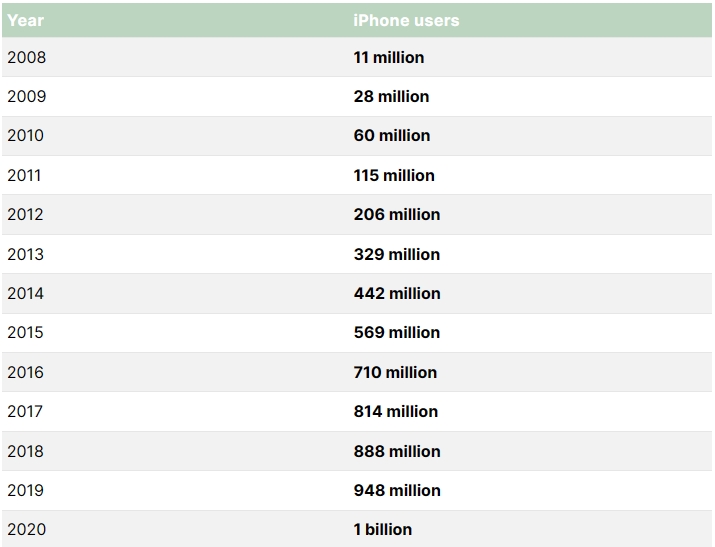
Source: Above Avalon.
iPhone shipment volumes
Apple delivered 55.2 million iPhones in the first quarter of 2021. That’s a significant year-over-year increase of 50.4%.
Throughout the whole of 2020, iPhone shipments reached 206.1 million units. Shipments were up 7.9% compared to the previous year.
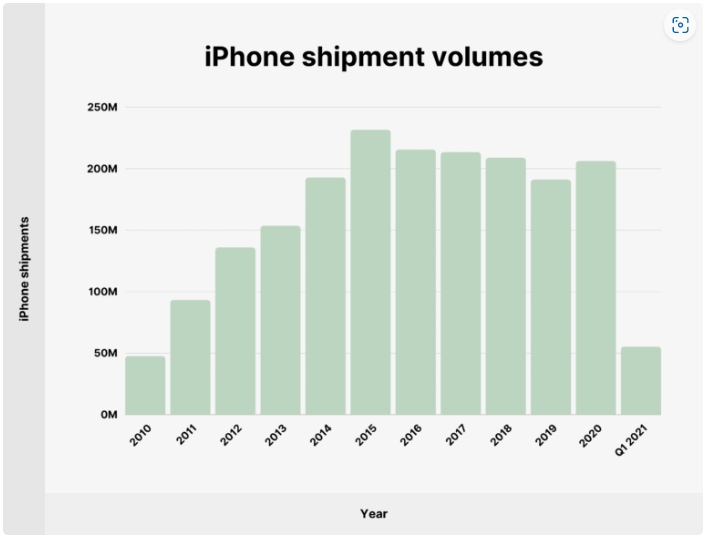
However, the volume fell short of the all-time high of 231.5 million shipments achieved in 2015.
We’ve charted annual iPhone shipments since 2010:
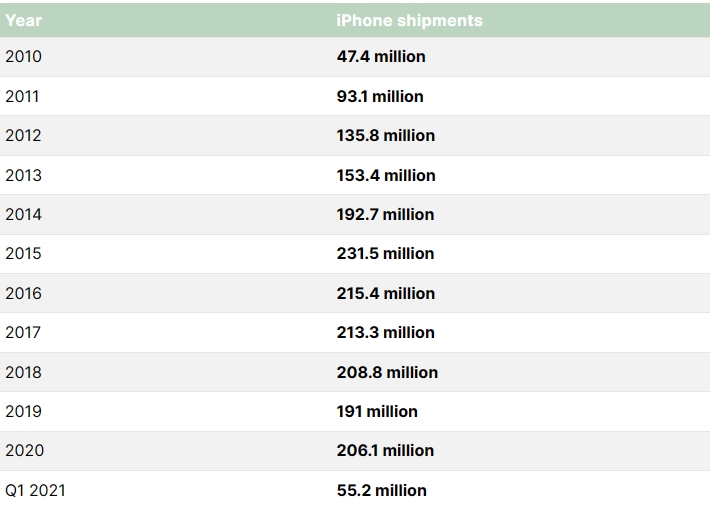
Sources: Statista, IDC.
iPhone worldwide market share
iPhones accounted for 16.76% of global smartphone shipments in Q1 2021. That’s down from 21% in the previous quarter.
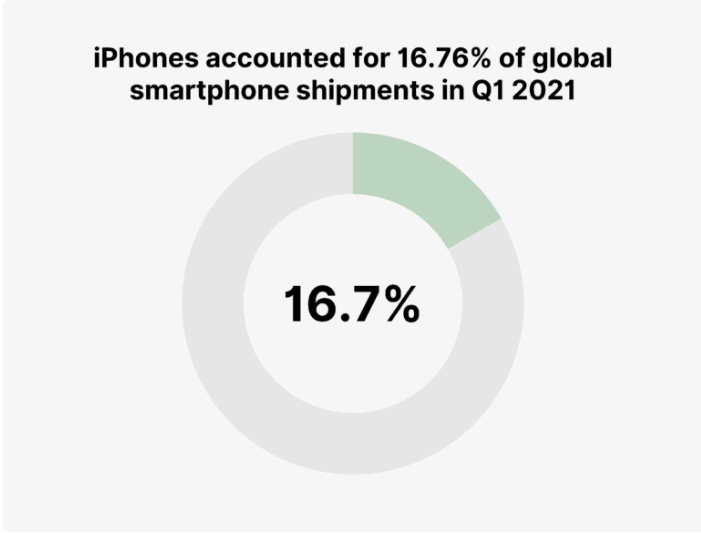
We’ve charted the iPhone’s share of worldwide smartphone shipments since Q1 2018:
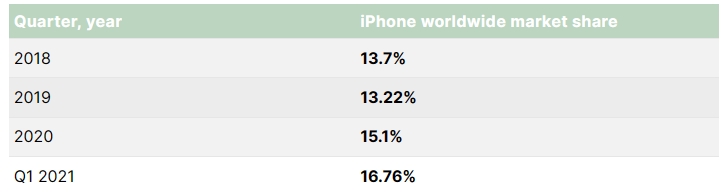
Source: Counterpoint Research.
iPhone US market share
iPhones account for 65% of smartphone shipments in the United States (as of Q4 2020). That’s increased from 49% in the final quarter of 2019.
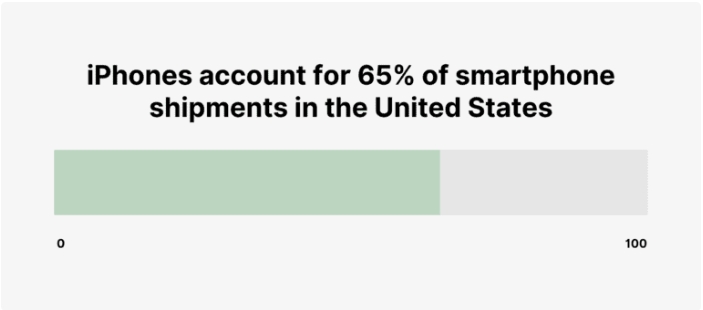
Market share fluctuates based on releases of new models by Apple and its competitors. Nonetheless, 65% is a record high for the iPhone.
Here’s a table showing the iPhone’s share of US smartphone sales since Q1 2016:
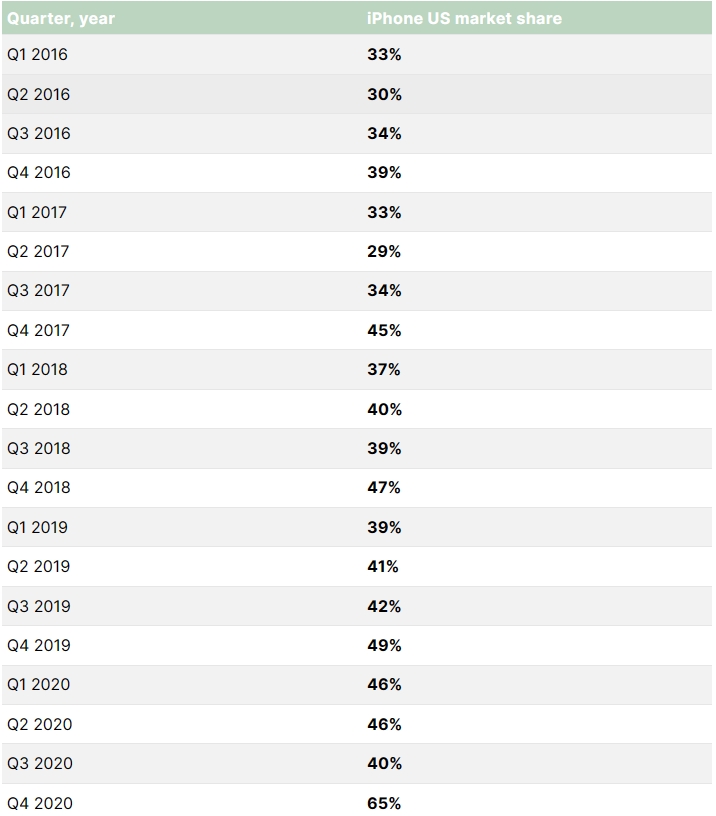
Source: Statista.
iPhone China market share
Apple’s iPhone held a 19.3% share of the Chinese market in 2020. That’s an increase of 2.17x over the previous year.
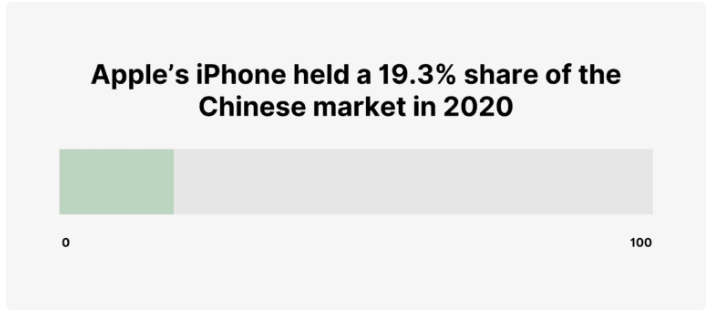
The iPhone market share in China dropped to 13% in the first quarter of this year.
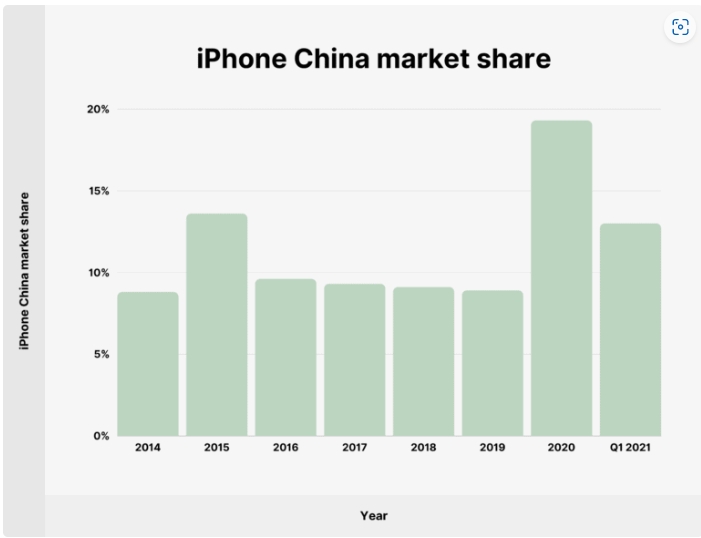
Here’s a table showing the iPhone’s share of smartphone shipments in China since 2014:
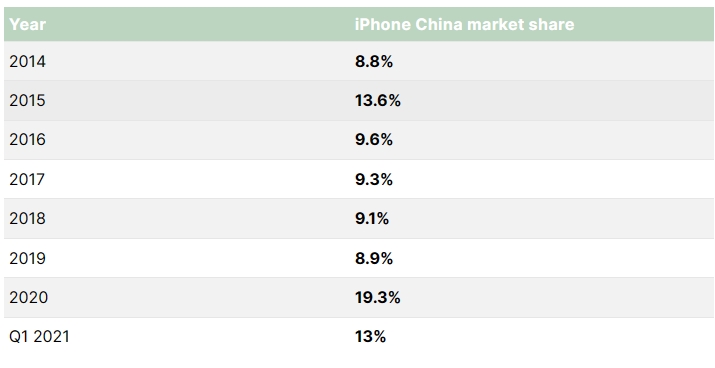
Source: Statista, Counterpoint Research.
What are the top-selling smartphones?
Per sales data from January 2021, Apple accounts for 6 of the top 10 best-selling smartphones.
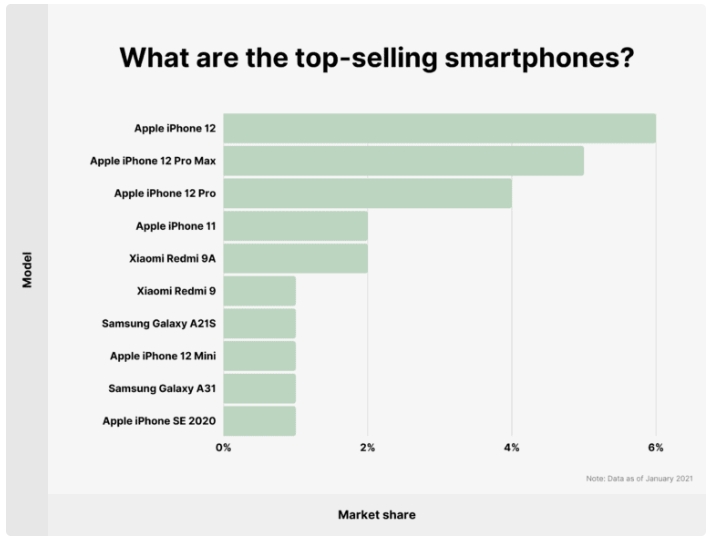
Various iterations of the iPhone 12 alone represent a 15% market share of global smartphones.
Here’s a list of the top 10 best-selling smartphone models in January 2021:
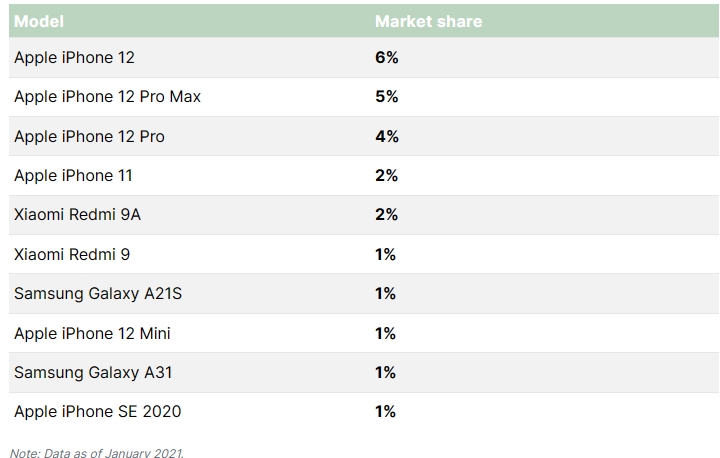
Source: Counterpoint Research.
iOS market share
iOS holds a 26.28% worldwide share of the mobile operating system market. That’s up from 22.71% in 2019.
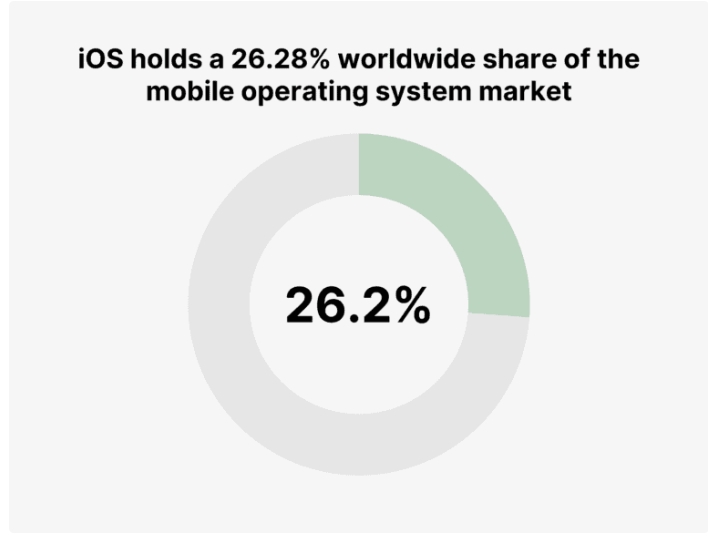
Android accounts for the vast majority of the remainder of the mobile OS market, holding a 73.06% share.
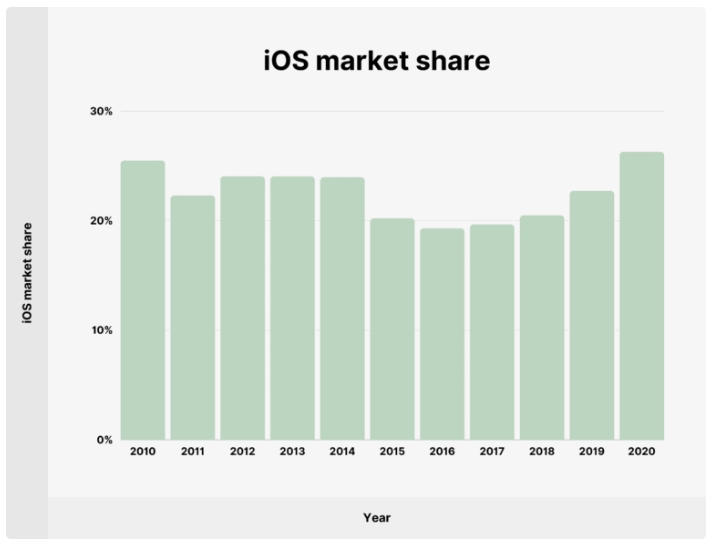
Here’s a table with the global iOS market share since 2010:
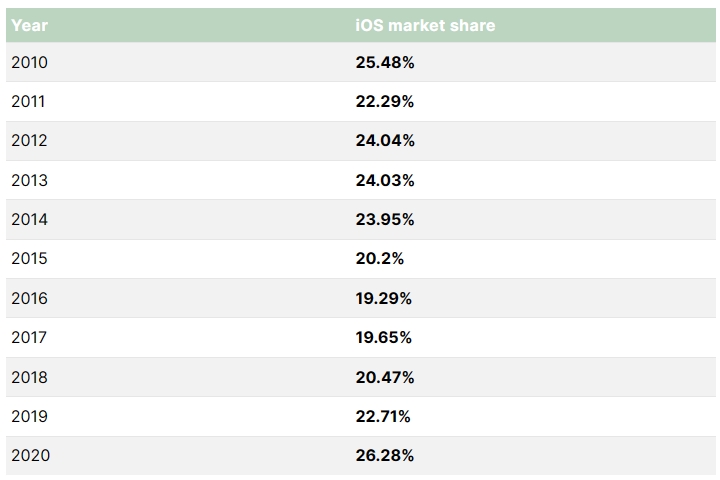
Source: Statcounter.
Conclusion
That’s all for my collection of iPhone stats for 2023. Hopefully, you found the data interesting.
Apple continues to strengthen its standing in the smartphone market. The brand has risen to a position of particular dominance in the US.
Now I’m curious to have your input:
What’s your opinion on the future of iPhones? Can the brand maintain its leading global position?
I’d also love to hear from you with any questions or remarks you may have. Just drop them in the comments section below, and I’ll get back to you ASAP.